LiveNX Engineering Console User Interface
About the Engineering Console User Interface
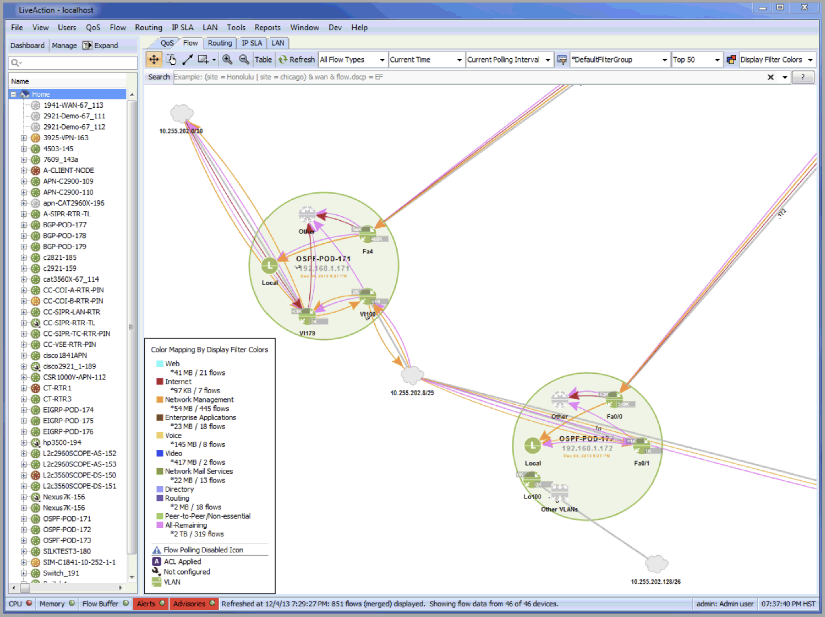
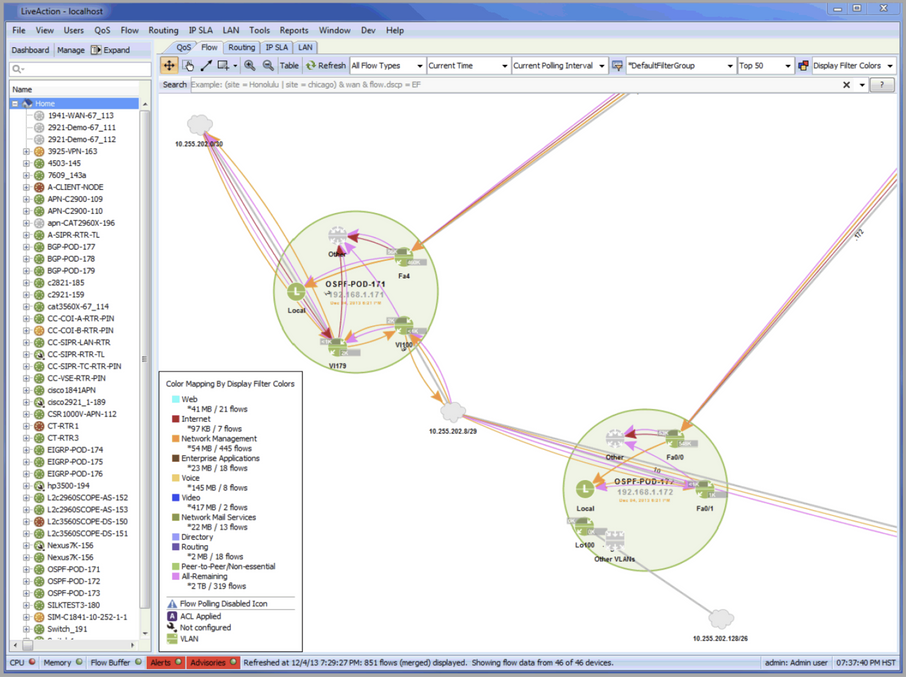
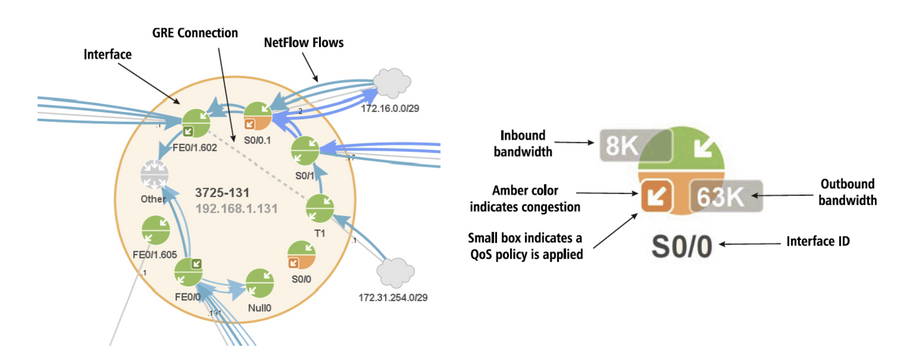
In the topology view, the objects in the main window represent network devices, subnets, and other user-definable objects. The larger circles represent network devices. Individual interfaces are shown as smaller circles inside the network device. Devices may be organized into groups that will appear as annotated, colored rectangles.


The top half of each interface represents inbound traffic and the bottom half represents outbound traffic. The color of each half indicates its status—green indicates normal, orange indicates congestion, and gray indicates the interface is disabled. Inbound and outbound bandwidth values for each interface can be displayed by right-clicking on the device.
